The Web Site Response Time Model
 Yesterday I introduced a reference model for Web site availability, and promised to write more about its uses today. But I have since decided to first introduce the equivalent model for Web site response-time. Then I will compare and contrast the uses of the two models, because -- although similar -- their application is not identical.
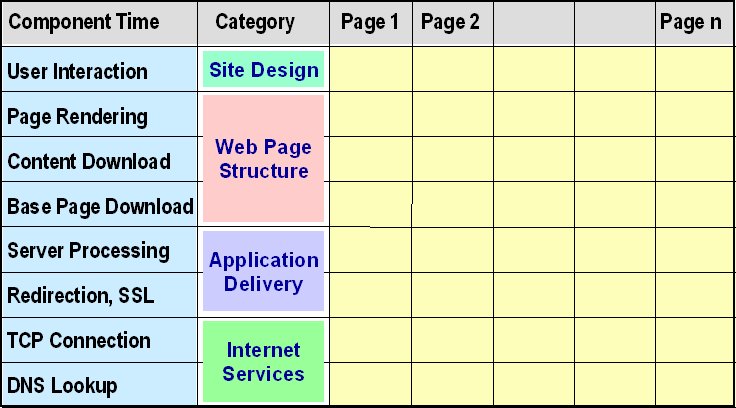
The response time reference model illustrated by the diagram is a slightly updated version of the one described in a paper (E-Commerce Response Time: A Reference Model) I presented at the CMG conference in 2000.
A quick comparison with yesterday's post will show that the two models are very similar in structure. (And in appearance, thanks to my use of cut and paste to create the diagrams!) The two reference models have a similar purpose, and function at a similar level -- concepts discussed on page 2 of the 2000 paper:
Purpose: Each model proposes a way to subdivide a single quantity (Web application availability or response time as experienced by a site user) into its underlying components. That subdivision is essential because -- to produce the overall result a user experiences -- each of those contributing components must be separately designed, built, monitored, and managed.
Level: The two models share a common horizontal dimension. As the 2000 paper says: In an e-commerce application, each business transaction is implemented by means of a sequence of Web pages. And their vertical dimensions serve the same purpose: To partition ... the process by which a single Web page is served.
Because of differences in the nature of availability and response time, the vertical dimensions of the two frameworks are different, and their cells have slightly different meanings and uses. Yesterday I explained that in the availability model, cells represent distinct components of the Web infrastructure that must all work together to deliver a Web-based application to a customer. In the response time model, the cells represent distinct stages that together comprise that delivery process.
So the first (and simplest) use of these models is simply to identify, for any Web-based application, which cells contribute to availability and response-time. The next use is to record or predict the magnitude of those contributions. This is where the differences between the two quantities become most apparent:
Response Time: Response time components are simple to work with. The sum of the cells in each column is the total time a user spends interacting with that page, and the overall sum for a completed matrix is the time it takes to complete a task using that application.
Availability: If we want to adopt a similar approach to the response-time framework, we see immediately that we must use the cells to record unavailability, because we want to aggregate each component's contribution to the overall time the site or application is down.
But if we were to record the percentage unavailability of a component in every column where it is used, we would still run into problems because we would be counting the same overall percentage more than once. For example, imagine a Web server that is down 25% of the time. If we were to record an outage contribution of 25% for four or more pages of a Web transaction, and add these contributions, we would obtain an overall unavailability score in excess of 100%, which is impossible.
How do we fix that? If instead we record the outage percentage (or time) for a component in only the first column in which that cell is used, we avoid the problem of double-counting. [There is a sound technical justification for this method, which I will describe in a future post]. And because availability percentages are usually close to 100% (outage times are relatively short), we can usually add up all the cells in a model to produce a reasonable and useful upper bound (worst case) estimate of overall unavailability.
Admittedly, the various components typically incur problems independently of one another, so that in practice some outages may overlap. Overlapping component outages would make the true overall outage time (or percentage) less than the worst case estimate we obtain by simply adding the cells. But as long as all component availability rates are high, the error will be a minor one that we can live with if it makes the availability framework easy to use.
Uses of these frameworks will be my next topic.
[Chris Loosley] 10/29/2005 02:00:00 AM
![]()
![]()


0 Comments:
Post a Comment