NOTE: All posts in this blog have been migrated to Web Performance Matters.
All updated and new content since 1/1/2007 is there. Please update your bookmarks.

Monday, October 31, 2005

The Value of Reference Models

A reference model establishes a shared foundation -- a frame of reference, or conceptual framework -- that can then be used to structure subsequent discussions of a subject. For more details, the best resource I could locate online is this discussion of the OASIS SOA Reference Model. Its focus is different from ours, but it contains some good general points, including:
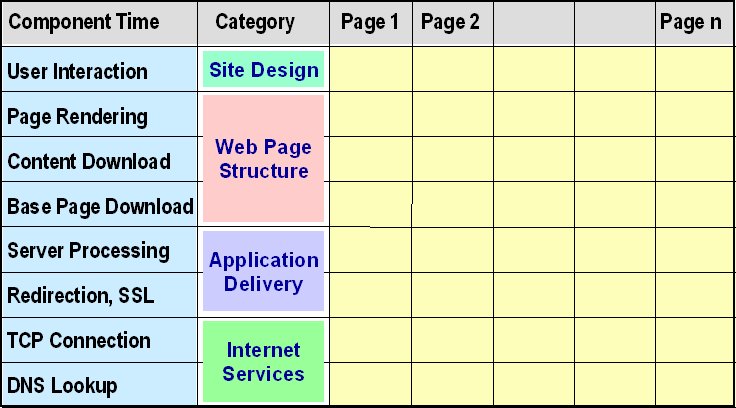
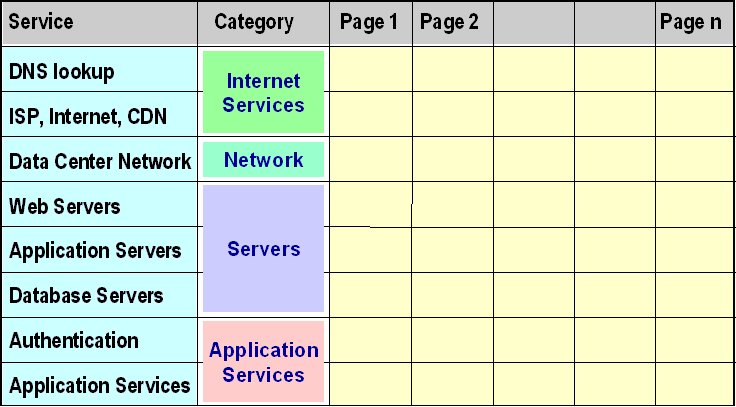
A reference model is an abstract framework for understanding significant relationships among the entities of some environment.

A reference model is based on a small number of unifying concepts and may be used as a basis for education and explaining standards to a non-specialist.

A reference model is not directly tied to any standards, technologies or other concrete implementation details, but it does seek to provide a common semantics that can be used unambiguously across and between different implementations.
In my two previous posts, I presented reference models for Web application availability and response time. These models enumerate the major components that determine the performance of any e-business application. This emphasis on identifying the contributing factors reveals another essential characteristic of all reference models -- the need for a model to be complete. Reference models for Web applications will be of limited use unless they offer a way to identify all the components the affect the availability or responsiveness of any Web-based application.

Apart from their value as teaching tools, I see many potential uses for these reference models, no matter what aspect of SLM you need to focus on. By showing how the performance of the whole application is determined by the performance of its component parts, they can suggest:

  • ways to determine the design goals and service level objectives (SLOs) for components

  • the degree to which competing design ideas might improve performance

  • frameworks for designing a performance monitoring program

  • methods for predicting or summarizing overall availability or response times

  • where to focus remediation efforts, identifying component(s) most in need of improvement

  • ways to systematically evaluate and compare competing sites

  • frameworks for comparing the likely impacts of different technology choices

For example, the CMG paper in which I first published the response-time reference model discusses examples of how e-commerce application response times can be improved in three ways: by reducing the overall number of components, by speeding up individual components, and by moving some components off the synchronous response time path.

Of course, a reference model will only take you so far. Because of their level, these models are designed only to break apart application availability and response time into their major components, not to reveal everything that goes on "under the covers." For that level of understanding, each component must be further dissected, as I did when discussing the components of Web response time in the CMG paper.

But a reference model is usually a very good place to start from, no matter what your particular focus.

NOTE: All posts in this blog have been migrated to Web Performance Matters.
All updated and new content since 1/1/2007 is there. Please update your bookmarks.

Saturday, October 29, 2005

Sharpening the Saw

If you've read The Seven Habits Of Highly Effective People by Steven R. Covey, then you may remember that the seventh habit is Sharpening the Saw. The idea is that you should always allocate some time for personal renewal.

Because I find my work interesting, or make it so by treating new tasks as a challenge to be mastered, I have a tendency to forget about the seventh habit. But today a colleague reminded me about this, asking if my blog was fun or work related. Of course, my response was "it's both" -- and it is. But this exchange got me thinking that I did need to sharpen the saw from time to time. My own performance matters too.

I have therefore decided that from now on I will publish the blog only from Monday to Friday, and take the weekends off. Even if I do spend time writing over the weekend, I'll save the posts for publication during the week. It's not as if I'm going to be covering news that can't wait for a couple of days. So if you take time off to sharpen your own saws, you won't be missing anything.

Have a great weekend!

The Web Site Response Time Model

Yesterday I introduced a reference model for Web site availability, and promised to write more about its uses today. But I have since decided to first introduce the equivalent model for Web site response-time. Then I will compare and contrast the uses of the two models, because -- although similar -- their application is not identical.

The response time reference model illustrated by the diagram is a slightly updated version of the one described in a paper (E-Commerce Response Time: A Reference Model) I presented at the CMG conference in 2000.

A quick comparison with yesterday's post will show that the two models are very similar in structure. (And in appearance, thanks to my use of cut and paste to create the diagrams!) The two reference models have a similar purpose, and function at a similar level -- concepts discussed on page 2 of the 2000 paper:

Purpose: Each model proposes a way to subdivide a single quantity (Web application availability or response time as experienced by a site user) into its underlying components. That subdivision is essential because -- to produce the overall result a user experiences -- each of those contributing components must be separately designed, built, monitored, and managed.

Level: The two models share a common horizontal dimension. As the 2000 paper says: In an e-commerce application, each business transaction is implemented by means of a sequence of Web pages. And their vertical dimensions serve the same purpose: To partition ... the process by which a single Web page is served.

Because of differences in the nature of availability and response time, the vertical dimensions of the two frameworks are different, and their cells have slightly different meanings and uses. Yesterday I explained that in the availability model, cells represent distinct components of the Web infrastructure that must all work together to deliver a Web-based application to a customer. In the response time model, the cells represent distinct stages that together comprise that delivery process.

So the first (and simplest) use of these models is simply to identify, for any Web-based application, which cells contribute to availability and response-time. The next use is to record or predict the magnitude of those contributions. This is where the differences between the two quantities become most apparent:

Response Time: Response time components are simple to work with. The sum of the cells in each column is the total time a user spends interacting with that page, and the overall sum for a completed matrix is the time it takes to complete a task using that application.

Availability: If we want to adopt a similar approach to the response-time framework, we see immediately that we must use the cells to record unavailability, because we want to aggregate each component's contribution to the overall time the site or application is down.

But if we were to record the percentage unavailability of a component in every column where it is used, we would still run into problems because we would be counting the same overall percentage more than once. For example, imagine a Web server that is down 25% of the time. If we were to record an outage contribution of 25% for four or more pages of a Web transaction, and add these contributions, we would obtain an overall unavailability score in excess of 100%, which is impossible.

How do we fix that? If instead we record the outage percentage (or time) for a component in only the first column in which that cell is used, we avoid the problem of double-counting. [There is a sound technical justification for this method, which I will describe in a future post]. And because availability percentages are usually close to 100% (outage times are relatively short), we can usually add up all the cells in a model to produce a reasonable and useful upper bound (worst case) estimate of overall unavailability.

Admittedly, the various components typically incur problems independently of one another, so that in practice some outages may overlap. Overlapping component outages would make the true overall outage time (or percentage) less than the worst case estimate we obtain by simply adding the cells. But as long as all component availability rates are high, the error will be a minor one that we can live with if it makes the availability framework easy to use.

Uses of these frameworks will be my next topic.

NOTE: All posts in this blog have been migrated to Web Performance Matters.
All updated and new content since 1/1/2007 is there. Please update your bookmarks.

Thursday, October 27, 2005

The Web Site Availability Model

I am a mathematician at heart, and all mathematical conclusions are derived by deductive reasoning from a set of an initial set of assumptions (postulates or axioms). So it is natural for me to want to establish a clear foundation on which to build any discussion of performance matters.

To discuss matters of performance and SLM, we need to establish two kinds of frameworks: one for performance quantities (the things we must measure and manage), and another for the processes through which we conduct our measurement and management activities.

Up to now, I have been focusing largely on SLM process frameworks (like ITSO), and process details like how to select competitive response-time objectives for your site and how to report on them. Yesterday's framework dealt with how to use performance data, not with the data itself or how to collect it.

Today I am turning to the quantities that comprise performance. In my simple Web usability framework, I noted that customers have two basic needs -- Availability and Responsiveness. I am now going to expand upon those two aspects of performance, beginning today with a framework (or reference model) for thinking about site availability.

The model is illustrated by the diagram above. It is a matrix whose row and column labels are fairly self-explanatory, I think. Its cells represent common Web infrastructure components that must all work together to deliver a Web-based application to a customer. Not every page of every site will require every cell -- for example, displaying your site's home page may require only the top four cells in the first column. For more complex eBusiness applications, more of the cells will needed.

I developed this reference model in June 2005, while working on a presentation. I had previously created a similar one for response-time (E-Commerce Response Time: A Reference Model -- a topic for a forthcoming post), and I saw that my approach could also work for availability. At the time I could not find anything like it on the Web. Then last week I stumbled across an excellent paper, Application Availability:An Approach to Measurement by David M. Fishman, originally published in 2000. It includes a diagram (Figure 2. Service Decomposition) similar to the first column of mine, and the following discussion:

... a Web-based application can be decomposed into a set of measurement points for service-level indicators. A user or client of the application performing a transaction depends on all the lower-level layers to complete a transaction.

In this case, a user or client (i.e., a human or a browser) establishes a connection with a Web server over a network. The Web server connects with the application server, which processes business logic. The business logic in the application server connects to the DBMS for data retrieval as appropriate. And, of course, the DBMS runs on the operating system; it is only as available as the operating environment on which it executes.

Service availability can be measured or tracked only as a subset of the complete, end-to-end stack. With a design that allocates sufficient independence between layers, it's possible to speak of the availability of a series or set of services, each of which is a subset of the user's requirement to be up and running from end to end.

This is a very clear explanation of the ultimate point of an availability reference model: to deliver any service successfully to the customer, every cell that is needed must be available. So the reference model helps you understand better the diverse components that you must manage, to achieve your overall availability objectives. I will expand on this tomorrow.

The ABC's of Measurement Data

In previous posts I have focused mainly on setting response time objectives as an aspect of site usability, and on the Service Level Management process. I turn now to some discussions of performance measurements, and how to get the maximum value from them.

In my experience, companies usually have lots of measurement tools. Granted, some of them do sit on the shelf unused, but many are in use -- some even collecting data continuously. Despite all this data gathering, the value obtained from the data is often a lot less than it might be.

Today I will describe a framework, illustrated on the left, for addressing this concern. This diagram does not represent a process, but rather a conceptual framework. It comprises seven potential ways of exploiting performance data, each one involving a greater level of sophistication than its predecessor. As a mnemonic, the names of the levels bear the initials A-G. (A stroke of luck, aided by careful selection of terminolgy).

Aggregate: The essential starting point. Raw data has its uses -- you need individual data points to investigate exceptions, and scatter plots do reveal some patterns. But most uses for performance data demand summary statistics. Availability percentages, and the Apdex metric (a new way to report response times) are just two examples of many. All performance analysis tools, except those specifically intended only for detailed tracing, support this level.

Broadcast: Once your tools have summarized the data, it does absolutely no good unless it is sent to someone who looks at it. It's amazing how many so-called performance monitoring systems break down here -- data is collected, summarized, then filed away, never to be looked at. In the 70's it could be found in a pile of computer printouts collecting dust behind someone's desk, today it's in a file somewhere on the network. That does no good. Stewart Brand coined the famous phrase information wants to be free. My corollary is information about performance wants to be seen! It needs to come out of the server closet and be put on display in a dashboard, where it can be useful.

Chart: If a picture is worth a thousand words, then a chart is worth a thousand spreadsheet cells. A well-chosen set of charts and graphs can help you see the patterns in your aggregate statistics, turning your data into information. Spotting a pattern in a table of numbers is as difficult as spotting Waldo in a maze of comic-book kids.

Diagnose: Patterns (whether found manually or by a tool) are the key to detecting problems (alerting), isolating in which major component of your application or infrastructure those problems lie (triage), and finally discovering (diagnosing) their causes. Over time, tuning your charts can get you through this process faster. In practice, there are very few truly new problems, but we have a tendency to fix and forget, so they come back to bite us. Hold post-mortems, and refine your process.

Evaluate: In polite society, maybe comparisons are odious -- or odorous, depending upon who you are quoting. But in the world of SLM, comparisons, far from being undesirable, are essential. Reasonable objectives will be defined by the prevailing Web environment and your competition, and the essence of performance management is to continually evaluate your site against those objectives. Ultimately, user comparisons will help determine your site's success or failure.

Forecast: Projecting future performance is vital component of SLM, otherwise you will be forever dealing with surprises and crises. And understanding your systems' and applications' performance today is the only starting point for projecting how they will behave under load tomorrow. Or during the holiday season. Or when marketing launches that big product promotion. This is an aspect of SLM that my colleague and team member Donald Foss will surely be writing about here, when he gets a spare moment. (With the holidays on the horizon, he's busy these days helping his customers predict their future performance).

Guide: Many details must come together to create the ideal world of ITSO, in which you consistently meet IT service levels while minimizing infrastructure costs and mitigating risks. Not the least of these will be the catalog of best practices you develop for yourself, in the course of measuring and understanding what makes your Web applications tick. These should be captured, documented, and institutionalized in your development processes, so that the hard-earned performance lessons of the past become guidance for the future. This is how the very best companies get the top -- and stay there. Look for my colleague and team member Ben Rushlo to share some of his experiences in this area soon.

I hope this taxonomy and short overview of the uses of performance data is useful. And if you do not learn anything new about performance, at least maybe some of the incidental references will be interesting. Finally, if you really think my scheme needs more letters, please write and tell me what they are. I may be an old dog, but now that I'm getting the hang of blogging, I'm ready to learn some new tricks.

NOTE: All posts in this blog have been migrated to Web Performance Matters.
All updated and new content since 1/1/2007 is there. Please update your bookmarks.

Wednesday, October 26, 2005

Performance: Déjà Vu All Over Again

Teamquest ITSO ProcessA few days ago, an email from TeamQuest offered me a whitepaper on The Renaissance of Performance & Capacity Management in the 21st Century. The email points out that anyone involved in IT for a reasonable amount of time understands that the IT industry is cyclical and says that a data center renaissance is coming full circle.

This got my attention, and not only because it is redundant (coming full circle implies rebirth, the meaning of renaissance). But we've learned to live with worse, especially in direct mail. Anyway, what makes this particular life-cycle so interesting to me is that I have actually participated in it at every stage. Here is my "cliff notes" version of TeamQuest's history of Capacity Planning:

Early 70s: Mainframes were almost the entire IT industry. The hardware manufacturers generated reliable income streams by persuading IT departments to upgrade the entire machine when the CPU hit 70% utilisation. An IT manager typically did not have the tools, the credibility, or the courage to dispute a vendor's recommendation.

Late 70s: Performance and capacity management products allowed IT departments to better understand their mainframe systems. Companies also started relating IT to the business, by subdividing performance metrics into workloads based around applications.

The 80s: The new distributed era forced companies to install performance software just to keep up with new technology.

Early 90s: Capacity management provided the means for testing machine consolidation and disaster recovery scenarios as well as its traditional predictive “what-if?” capabilities. Companies created capacity management departments, software was in abundance and it seemed that performance and capacity management had finally come of age.

Mid 90s onwards: The Web gave birth to eCommerce, and IT became synonymous with the business. Companies now cared more about IT performance than ever before. Hardware was cheap, so money and hardware were thrown at performance problems in a frantic bid to make them go away. Not surprisingly, this rarely worked, and as a result, IT departments have been losing credibility.

Today: We have come full circle. An over abundance of hardware and a general lack of understanding as to how it affects performance means that performance and capacity management is now more important than it has ever been.

This is a pretty good summary of what I have seen happen over the course of my career as a performance specialist. So what's the whitepaper's punch line? It comes in two parts, actually. The first is the need for companies to adopt the approach of IT Service Optimization (ITSO), the five-step TeamQuest process shown in the chart. The goal of ITSO is to consistently meet IT service levels while minimizing infrastructure costs and mitigating risks.

While ITSO is a proprietary label, the principles TeamQuest is promoting are aligned with the ITIL industry standard and the ITSMF organization. These initiatives are designed to address the issues I described in my earlier post on SLM. This entire subject is a familiar one -- it occupies three chapters and 115 pages in my book, and I will be writing about it again in future posts (which will include reference to the second half of TeamQuest's conclusions).

For old hands in this industry, the idea of things 'coming full circle' is always interesting. Not always to be welcomed, but often so. Why? Because rebirth confers instant expertise -- we can reuse our hard-bought experience. The imagination races at the prospect! We will be asked to tackle problems we have already solved, to figure out the answers to questions when we have already seen the exam paper.

Or, foes who defeated us the last time are returning for another round, and this time we will out-fox them. As in Bill Murray's Groundhog Day, if you re-live the worst day of your life enough times, eventually you will get it right. A few of us have been in IT for long enough to relate to this personally. Bring on the renaissance, we're ready!

NOTE: All posts in this blog have been migrated to Web Performance Matters.
All updated and new content since 1/1/2007 is there. Please update your bookmarks.

Monday, October 24, 2005

Delight, Satisfy, or Frustrate?

My recent posts have discussed the relationships among user expectations, site responsiveness, and user satisfaction. To sum up the conclusions of all the research I have seen (and done) into Web download times, Web users’ tolerance for delays depends on several factors, including their expectations, site feedback, the complexity of a task, its importance, and the relevance (utility) of the information being provided by the site. But their perception of a site’s quality and credibility diminishes as its download times increase.

Today I am going to shift my attention to performance management. For an eCommerce company embarking on a program of Service Level Management (SLM), what are the implications of all this research? How should you set response time objectives? Here are my conclusions:


  • Treat Miller’s thresholds as a design framework to be kept in mind (more on this below).
  • Forget about Bickford's 8-second rule! Web norms have progressed since 1997.
  • What really matters are the service levels your customers expect. You can delight them, satisfy them, or frustrate them by delivering levels of responsiveness that they perceive to be fast, reasonable, or slow respectively.

Writing about the role of evolution in site design, Jared Spool observed:
"For most types of sites, there are existing models already out there. Someone who wants to produce a new site with pharmaceutical information, for example, can find dozens of existing pharmaceutical sites. A small investment in studying how users interact with existing sites can reveal a lot about what works for your users on their tasks. You could easily develop an understanding of the best practices and, from that, produce your own guidelines".

The same applies to your users' perceptions of performance, and how those should determine the objectives you set for your site. Because those perceptions will have been set by other Web sites (including your competition), the performance of comparable online services delivered by other sites in your market segment should be your starting point. You can never go wrong by measuring your competitors and striving to match them.

For example, Keynote's Public Services division publishes weekly indexes of Web site performance for several industry verticals. Many companies in these markets monitor these indexes as an important benchmark of the competitive climate, and of their own site’s quality.

Some leading companies have taken this approach several steps further, setting up comprehensive measurement, tracking, and reporting programs for their most important Web initiatives, and letting their measurements of the competition drive their own service level objectives. One company even recalibrated the annual performance objectives and bonuses of IT and development staff, based on their ability to match competitors’ performance. And it works! The company improved from last to first place in its industry by following this SLM strategy consistently over a 3-year period.

So if matching the competition is everything, how are Miller’s thresholds relevant? I see them as absolute standards within which you will frame your relative (competitive) objectives. Although you should aim to compete, you can relax a bit more if you are already close to meeting Miller's guidelines. For example, if your competitors can find widgets in 4 seconds, your site's 8-seconds response is too slow. But if they take one second and your site takes two, you are doing OK -- focus your tuning efforts on another online application that needs help. For additional perspective on this subject, I recommend reading this 2002 exchange in Business Communications Review between Peter Sevcik and Peter Christy.

A related aspect is the nature of the service your site is providing, in response to the user's input. Miller proposed that ideally all computer responses should occur within two seconds. But in practice, it is reasonable to absolve some complex interactions from this 2 second target, if you are sure that the customer would not expect the response in 2 seconds. Credit card validation is a good example. If in doubt, be guided by what other sites can achieve for a comparable function. The subject of Web "norms" for various types of interaction is one that I plan to revisit here. It is already being discussed in the context of the Apdex approach to setting objectives and reporting response times.

To sum up, performance matters! It affects your bottom line, if you are doing business online. And to win at eCommerce, you cannot be content just to match your competition at every turn. Look at the situation from their point of view. Their customers’ expectations will also be based on the prevailing Web climate. So if your site is faster, the competition can no longer delight their users with their responsiveness – the best they can do is satisfy them. This gives your site an edge in the usability stakes, which a competitor must now try to compensate for by doing better in some other aspect of their site. If they don't, and remain noticeably slower for an extended period, eventually some of their customers will become frustrated, and switch to your service.

So having a faster site gives you a competitive advantage. This is where the money you have invested in your SLM program really pays off. I've been working in this area recently, and in future posts I will be writing more about the value of SLM, and how to calculate return on investment (ROI).

NOTE: All posts in this blog have been migrated to Web Performance Matters.
All updated and new content since 1/1/2007 is there. Please update your bookmarks.

Sunday, October 23, 2005

WYSIWYG, or No Site is an Island

When writing about Human-Computer Interaction (HCI), I discussed Robert B. Miller's classic research into computer responsiveness and its relevance today to questions of Web site design and site usability. For one response to Miller's findings (by providing more percent-done indicators and busy cursors) see Jakob Nielsen's Web site and his book, Designing Web Usability.

But Miller's three thresholds are far from the whole story. Some digging on Google will reveal that in the last 10 years, scientists around the world have investigated the effects of page download time differences on Web users. Why did these researchers , who were usually aware of (and often referenced) the earlier results of Miller and Bickford, feel the need to conduct new studies focused on the Web? Was it because the Web was reaching a new population with no previous experience of mainframes or hypertext systems? I don’t think this is a sufficient explanation, because Miller’s results are still applicable. I believe it was because they understood that people’s ultimate experience of, and response to, any computer interaction depends most of all on their prior expectations.

In his Law of the Internet User Experience, Nielsen pointed out that Users spend most of their time on other sites. In July 2000 he concluded that this fact, together with others, would lead to the End of Web Design -- meaning that Web site designs would converge. Five years later, it is clear that his controversial conclusion has not really come to pass.

While some common idioms and design patterns have emerged, most would agree that site designs still vary widely. In fact, in September 2004 we find Nielsen himself comparing the Web to an anthill built by ants on LSD. Writing about The Need for Web Design Standards, he observes that while users expect 77% of the simpler Web design elements to behave in a certain way, ... confusion reigns for many higher-level design issues.

I believe a key reason for this state of affairs is the presence of what Jared Spool labels design evolution, as sites adapt to observed user behavior. Evolution promotes both diversity, as novel traits emerge to take advantage of environmental niches, and convergence, as less efficient species tend to become extinct. Jared's conclusions about design evolution touch on both aspects:
A small investment in studying how users interact with existing sites can reveal a lot about what works for your users on their tasks. You could easily develop an understanding of the 'best practices' and, from that, produce your own guidelines. [Convergence]

Because you will generate your guidelines by directly observing your users, these guidelines are far more likely to be of value than generalized guidelines produced from sites that have little or nothing to do with your work. Evolution has produced these sites and you can identify which have won the 'survival of the fittest' competition. [Diversity]
In nature, the attribute of speed evolves in only one direction, because faster individuals more often capure their prey and escape predators. On the Web, human nature, specifically our impatience, drives up individual site performance. One consequence of Jakob's Law that he did not write about is that users' expectations of site performance must inevitably converge, because they are set by their experience of other sites. As sites get faster, people expect faster sites, and are less tolerant of slower ones.

While Miller’s findings identified some important (and largely invariant) behavioral thresholds that apply to all human-computer interactions, an individual person's satisfaction with their interaction with a Web site will always be determined by more than those thresholds alone. The key additional ingredient is their prior experience of the Web environment as a whole, which sets their expectations and provides the context in which they can judge subsequent online interactions.

Nielsen's latest candidate for the scrap heap is the old acronym WYSIWIG. So maybe it's OK to recycle it with a new twist: As a Web user, what you suppose is what you got. Or, as John Donne might have adapted his metaphors for today's interconnected world:
No site is an island, entire of itself
Every site is a piece of the Web, a part of the environment

NOTE: All posts in this blog have been migrated to Web Performance Matters.
All updated and new content since 1/1/2007 is there. Please update your bookmarks.

Saturday, October 22, 2005

The Miller Response-Time Test

In the field of Human-Computer Interaction, HCI for short, one crucial and much-studied aspect is the speed of the computer's response to various kinds of user inputs. Although a few of these studies do get quoted in discussions of Web site design and Web usability, most books and articles on these topics devote very little space to this aspect.

One of the best summaries appears in Andrew B. King's book Speed up Your Site, which opens with the simple observation that People hate to wait. His first chapter (Response Time: Eight Seconds, Plus or Minus Two) includes a brief history of HCI research into the influence of computer response time on user satisfaction (or frustration), and an overview of its relevance to Web site usability.

In the early days of the Web, Service Level Management meant little more than keeping your site up and running. Then came the 8-second rule of Web page download time, as people began focusing on the need to build and maintain a consistently responsive Web presence. This rule originated in research results presented by Peter Bickford in his paper Worth the Wait?, published by Netscape in 1997.

For a while, Bickford’s paper was widely quoted whenever Web site performance was discussed, and the 8-second statistic soon took on a life of its own as a universal rule of Web site design. Bickford’s actual results however were more variable that this simple “rule” might suggest. Only half the test subjects abandoned after 8.5 seconds, and site feedback (like animated cursors or progress bars) kept them around for much longer.

Interestingly, the 8-second rule was by no means the first widely accepted rule in the field of human computer interface design:

  • In the world of hypertext systems (which predate the Web and HTML by about 25 years), Akscyn’s Law was well established prior to the first Hypertext Conference in 1987. It states: “Hypertext systems should take about 1/4 second to move from one place to another. If the delay is longer, people may be distracted; if the delay is much longer, people will stop using the system”.

  • As long ago as 1968, when all computers were mainframes, Robert B. Miller’s classic paper on Response Time in Man-Computer Conversational Transactions described three threshold levels of human attention. A response time of one tenth of a second is viewed as instantaneous, a response within 1 second is fast enough for users to feel they are interacting freely with the information, and response times must stay below 10 seconds to keep the user’s attention focused on the dialog (note that this is similar to Bickford’s findings). Miller also concluded that a consistent 2 second response would be ideal.


Many researchers have investigated the subject of Web responsiveness since Bickford, but no new universal rules have emerged. This is no surprise, because Miller’s findings were a direct result of how people’s brains operate, and they applied to any human interactions with machines. Changing the machine from a mainframe terminal to a Web site has not changed people’s brains.

So how does the Web experience today measure up to Miller's norms? Jakob Nielsen has been writing about this aspect of Web usability for over 10 years, and although he is still pessimistic about Internet technology in general (see The Need for Speed) the very best and most popular sites are actually doing OK these days. The home page download times of the top 10 or so sites in The Keynote Business 40 index do achieve Miller’s 1-second threshold (for users with a high-speed connection). Many more pages achieve Miller’s 2-second guideline.

But it’s still safe to say that the vast majority does not yet pass the Miller Response-Time Test of computer usability. So if your site's pages are slower, then you still have some work to do before you can feel assured that their design is ideally suited for human-computer interaction. Dogs maybe, but not humans.

NOTE: All posts in this blog have been migrated to Web Performance Matters.
All updated and new content since 1/1/2007 is there. Please update your bookmarks.

Thursday, October 20, 2005

The Application Performance Index

Yesterday I introduced the subject of Service Level Management, or SLM. To manage application service levels effectively, and satisfy your customers, you must monitor and report on availability and response times. So if you collect 10,000 measurements, what's the best way to report them?

Availability percentages are the easy part; they tell a story that everyone can understand. If 5 of your measurements failed, then your availability for that period was 99.95%. All you have to do is report the overall percentage for management tracking purposes, and perhaps summarize the causes of the 5 errors for technical staff to follow up and see if those kinds of errors can be reduced or eliminated in future.

Aggregate response time statistics are not nearly as self-explanatory. Assuming that you have set response objectives for that application, statistics like average response times (or even averages with standard deviations or confidence intervals, for the statistically minded) do do not really show how well you are meeting your goals and satisfying your customers. While technicians may have the time to discover important patterns from frequency distributions and scatter plots, managers need a quick way to understand the bottom line.

This is especially true of Internet measurements, whose distributions can be so skewed that their average does not represent the “middle” of the data. In practice, a few really slow measurements can push up the average, so that as many as 85% of all measurements may actually have been faster than the average. This presents a challenge, especially if you have set different response objectives for many pages of your Web applications, and those pages exhibit different response-time distributions. Reporting that "average response time was 3.7 seconds" is not very informative.

How then should you summarize and report page response times? Until recently, there was no accepted way to reduce response-time data to a common scale that would immediately show managers the level of success being achieved through their SLM efforts. Apdex, short for Application Performance Index, is a new open standard that seeks to address this problem. An alliance of companies whose business is measuring performance has defined the Apdex metric, a user satisfaction score that can be easily derived from any set of response time measurements, once a response time goal has been set.

The Apdex specification defines three zones of responsiveness: Satisfied, Tolerating, and Frustrated. The satisfaction threshold (T) is your response objective, and the frustration threshold (F) is always set to 4T. This simple rule is justified by the empirical findings of usability research, which will be a topic for a future post. The Apdex metric is computed by counting the satisfied samples plus half the tolerating samples (and none of the frustrated samples), and dividing by the total sample count.

The result is a number between 0 and 1, where 0 means no users were satisfied, and 1 means all users were satisfied. For example, if there are 100 samples with a target time of 3 seconds, where 60 are below 3 seconds, 30 are between 3 and 12 seconds, and the remaining 10 are above 12 seconds, the Apdex score is (60+30/2)/100, or 0.75. This result can be reported in one of two standard formats: 0.75[3.0], or 0.75 with a subscript of 3.0. The key point is that any display or report of an Apdex metric always includes the value of the target T that was used.

So if you achieve an Apdex score of 1.0 by setting yourself the easy target of 25 seconds, your reports must show 1.0[25]. But if you use more appropriate Apdex thresholds that truly reflect the level of service you want your customers to experience, then your Apdex score will tell you how successful you are in reaching your own goals.

I believe the Apdex approach is a really good idea, and I will be discussing it further in future posts.

NOTE: All posts in this blog have been migrated to Web Performance Matters.
All updated and new content since 1/1/2007 is there. Please update your bookmarks.

Tuesday, October 18, 2005

Service Level Management (SLM)

Building and maintaining first class e-business applications demands a systematic commitment to delivering levels of quality that can be measured and managed. Companies must address many inter-related issues, including:

  • What level of performance do our customers really expect?

  • How can we match, even stay ahead of, the competition?

  • How will we prepare for our next big sales event (or season)?

  • How will we measure site and application responsiveness?

  • How will we know when our customers experience a drop in service levels?

  • How do we diagnose and fix problems quickly?

  • How will we monitor, quantify, and report on our success?


The management and technical activities required to tackle these issues are collectively called Service Level Management, or SLM for short. To implement SLM successfully, many people with diverse skills and responsibilities must contribute, because SLM touches every aspect of the application lifecycle -- site design, database design, application programming and testing, systems management, and networking.

This is a broad topic, every aspect of which I will probably be writing about here at one time or another. Having worked for years in the world of software and application performance, I tend to use the terms Service Level Management and Performance Management interchangeably. But these days, people without that background are more likely to interpret the word "performance" as a reference to Business Performance, or BPM for short. So unless the meaning is clear from the context, I will try to remember to use the SLM terminology.

If you would like to read a book about SLM for the Web, I recommend Practical Service Level Management: Delivering High-Quality Web-Based Services by John McConnell and Eric Siegel. As a friend and former colleague of Eric's, I am a little biased. But I think the Amazon reader reviews speak for themselves.

Web Usability: A Simple Framework

Web Usability is a big topic. I just Googled "Web Usability" and got 2,350,000 hits. "Web Usability Guidelines" is slightly more manageable, with only 598 hits. There is even a widely referenced research paper devoted to A Framework for Organizing Web Usability Guidelines.

[This reminds me of a saying I learned as a college student: "Those who can, do. Those who can't, teach. And those who can't teach, teach the teachers." Maybe if I scour Google for long enough, I'll find a framework for organizing Web usability frameworks. But I digress.]

I own several books on Web Usability, and I've looked at a far greater number of books and Web sites at one time or another. It's not hard to find long reading lists like this one by Paul D. Hibbitts. This appears to be a good list -- but who has time for that much reading? I will try to assemble a much shorter list of recommendations for a future post.

Despite (or maybe because of) the widespread attention to this topic, there are many ways to slice the usability pie, and each author seems to offer a different taxonomy. But all the best books do have one thing in common: their weight! No matter who you read, they give you a lot of guidelines to follow. In fact, far too many for my liking.

Being a simple-minded mathematician at heart, I am always looking for those few principles that will provide a sufficient foundation for most of what I need to remember. So, since I'm mostly interested in the role that site performance plays in determining usability, here is my own simple framework. I believe that to satisfy customers, a Web site must fulfill four distinct needs:

  • Availability: A site that’s unreachable, for any reason, is useless.

  • Responsiveness: Having reached the site, pages that download slowly are likely to drive customers to try an alternate site.

  • Clarity: If the site is sufficiently responsive to keep the customer's attention, other design qualities come into play. It must be simple and natural to use – easy to learn, predictable, and consistent.

  • Utility: Last comes utility -- does the site actually deliver the information or service the customer was looking for in the first place?


Until a customer has established a reason to stay on a site, I believe this framework presents the four essential qualities in order of their significance, and therefore applies to all first-time visitors. Familiarity with the site can alter a customer’s priorities, but only a prior knowledge of some unique utility not obtainable from other sites can overcome frustrating slowness or poorly designed navigation features.

For my purposes, this is enough detail. For the time being, at least, adopting this simple framework saves me from having to attend Jakob Nielsen's tutorial to learn Which of the more than 1,200 documented Web usability guidelines are most important? But I would hazard a guess that about 85% of those guidelines, and those proposed by other Usability experts, fall under my heading of Clarity.

On the other hand, I don't believe that issues of Clarity represent anything like 85% of the challenges to be overcome to make a site truly usable. Such an assumption would not give enough weight to the challenges presented by the other three areas. It would also downplay the dynamic nature of the Web experience and the interplay between these four factors as sites, and users' expectations of sites, evolve.

In particular, I believe that anyone responsible for setting site performance goals needs to understand how customers' expectations are likely to be modified by their experience of a site, and of the Web in general. And understanding what customers expect is the essential first step in providing a satisfying Web experience.

Eventually I plan to tackle this subject at the next level of detail. But first I may need to read a few more of the books on Paul Hibbitts' list!

NOTE: All posts in this blog have been migrated to Web Performance Matters.
All updated and new content since 1/1/2007 is there. Please update your bookmarks.

Sunday, October 16, 2005

When is Your Web Site Fast Enough?

When your business is your Web site, and site responsiveness affects customer satisfaction, how much to budget for improving site performance becomes an important business decision.

Companies doing business on the Web must manage both site availability and site responsiveness. It's relatively easy to justify spending money to ensure site reliability; when customers can’t reach your site, you're losing business. And even if you can’t assign a precise dollar cost to every outage, at least everyone understands why the ultimate goal is 100% availability, and why a 10% downtime record is likely to be ten times more damaging to the business than 1%.

A cost/benefit analysis of responsiveness is a lot trickier; how much should you invest in speeding up your site? Faster may be better, but how fast do you really need your site to be? And even if you have set a target, what is the cost of missing it? These are the harder questions facing eCommerce executives today.

I wrote about this topic last week in eCommerce Times. The article provides a short overview of a very important subject, which I plan to write more about in future posts.

Why Performance Matters

In trade magazines and newsletters, articles featuring the “Top Ten Rules” are a staple feature. So anyone with even a passing interest in Web site design has probably seen a few checklists devoted to site usability. In essence, these lists present ways to keep visitors on your site --rather than driving them away in frustration. These guidelines are important for every Web site, but become absolutely vital when doing business online. Over the past ten years I’ve read many such articles -- and I have been delighted to see that they almost always list the importance of site responsiveness.

Why is this so pleasing? Well, having devoted most of my career to software performance engineering, I have always regarded performance as a fundamental cornerstone of software quality. But in the past, such concerns were often viewed as an arcane technical backwater. So it is gratifying to see that performance is now widely acknowledged as vital to Web site usability and customer satisfaction.

Software performance is a very large subject; I know, because I once spent two years writing a book (High-Performance Client/Server) about it. The book mainly describes timeless principles of performance engineering and how to approach distributed computing with performance in mind, but (since I wrote it during 1996 and 1997) the examples are a bit dated now. Its focus really needs updating to address the Web environment, but I don't think I'm going to find the time to do it.

Publishing a blog seems to be a better plan. I aim to contribute an organizing framework and a regular supply of ideas. And I also hope to keep things interesting by attracting comments and contributions from others. As Web users, we all know that site performance does matter, so I will try to make this an interesting place to discuss Performance Matters.

Table of Contents

[Last updated on 8/27/2006]

Foundations
Probability: The Rain in Spain ...
Waterfall Methods: Past and Ever-Present
Software Engineering Matters

Performance as an Aspect of Usability
Why Performance Matters
Web Usability: A Simple Framework
The Dimensions of Usability
Performance Matters for VoIP

Web Usability Books
1. Don't Make Me Think, by Steve Krug
2. Designing Web Usability, by Jakob Nielsen
3. The Design of Sites, by Douglas Van Duyne et al
4. Usability For The Web, by Tom Brinck et al

SLM Overview
Service Level Management (SLM)
Keeping a Public (Site) Healthy
Performance: Deja Vu All Over Again
The Web Site Availability Model
The Web Site Response Time Model
The Value of Reference Models

Managing Rich Internet Applications
White Paper Series:
    1. Introduction to RIAs
    2. SLM Issues for RIAs
    3. RIA Technology
    4. The RIA Behavior Model
    5. Measuring RIA Responsiveness: Introduction
    6. Measuring RIA Responsiveness: Complications
    7. RIA Usability and the Site Development Process
    Update: RIA White Paper and Wikipedia

Alistair Croll on Ajax
Reporting Web Application Responsiveness

Web Performance Engineering: Building in Performance
1. Ten Steps to a Faster Web Site, by Alexander Kirk
2. Web Performance Tuning, by Patrick Killelea
3. Speed Up Your Site, by Andrew B. King
4. Deliver First Class Web Sites: 101 Essential Checklists, by Shirley Kaiser

Setting Performance Objectives
When is Your Web Site Fast Enough?
The Miller Response-Time Test
WYSIWYG, or No Site is an Island
Delight, Satisfy, or Frustrate?

Capacity Planning and Load Testing

Measuring Performance
Deep Thoughts on Management
Yahoo! on Web Page Performance

Detecting, Diagnosing, and Fixing Problems
Keeping it on the Road

Reporting on Performance
The ABC's of Measurement Data
The Application Performance Index

SLM Cost/Benefit Analysis
The Business Case for SLM
SLM: Learning from Dot-coms
Armstrong on IT-Business Alignment
Climbing The SLM Maturity Ladder

Performance in the News
Insights from Interop 2006
Are Online Retailers Ready for Business?


Notes
  • This index will be updated to include references to all significant posts on performance subjects. Those posts may in turn have links to further posts on topics within their subject areas.
  • Although there is no editorial calendar, subject areas without links do suggest topics we hope to cover in future posts.